Introduction
This article is going to describe how to add a Zingchart control into a page using Angular 6. Let's see that in simple steps.
We have used Visual Studio Code to develop the solution.
Background
- If you love to start with .NET Core on a Linux server, check what are the basic things you have to do, Install .NETCore in a Linux server
- Say Hello from .NET Core application in a Linux server,.NET Core with a Linux server: Hello World!
- If you are interested in open source platforms and want to try out .NET Core application development in Linux, try with these steps,.NETCore: Create a web application with a Linux server
- If you want to know how to create an ASP.NET Core service application check this article,ASP.NETCore: Create a Web API application
- If you want to show a loading panel on the screen using ASP.NET Core, go through this article, ASP.NET Core : How to show a loading panel in a page
- If you like to use template generators for .NET Core this is the ideal article for you, .NET Core: Create web application with Yeoman template generator
- When you are developing ASP.NET Core web applications, security is a crucial thing, follow this article to know more about it, Secure your .NETCore web applications using IdentityServer 4
- Check how to show a confirmation dialog with jquery from this post, ASP.NET Core : How to show a confirmation dialog with jquery
- If you want to try out advanced features in jquery dialog on top of .NET Core, this will be a great article for you, ASP.NET Core : Advanced JQuery dialog actions
- If you are interested in user authentication & ASP.NET Identity follow this link, ASP.NET Identity: Customize User Authentication
- You can send a simple smtp email by checking this article, C#: Create a simple SMTP email with HTML body
- Check this article to know how to use a windows service to fire an email How to fire an email using a windows service
- If you ever want to log error messages, warning or any information in your application, you have to select a logging framework, Go through this article and learn what are the available logging frameworks, Log messages using NLog framework
- Check this article and learn how to use hashing and salting to protect your passwords, keys C#: How to generate a unique key or password using salting + hashing
- If you are a LINQ query fan and want to know few basic tricks, this is the article for you LINQ - list update tricks
- If you are interested to follow on ODATA queries, check this article ODATA Reads with Parameters
- Go through ODATA Reads to know about read queries with ODATA
- If you are interested to know about Azure storage, blobs check this article,Send smtp email with Azure blob storage attachments
- We are going to create a Function app and publish that in Azure, if you are curious to know more about Azure functions check this one, Azure Function App: Create a trigger on Cosmos DB
- If you are interested in Microsoft Graph and want to know more about Outlook API, check this article, NET Core: Building Function app with Microsoft Graph API and Azure Functions
- If you like to know about Microsoft Graph and how we can integrate our business solution with it, go through this article, .NET Core: Process a Excel file with Microsoft Graph API & Azure Function
- Check this article and get to know how to work with Azure Cosmos DB - Document API,Explore Azure Cosmos DB - document API
- Learn how to map your on premise database in to a cloud NOSQL based database, Azure Cosmos DB: Designing your data structure
- You can see a how to load a partial view using ASP.NET MVC ASP.NET Core MVC: How to load a partial view
- You can go through this article and see how to apply input value restrictions to textboxes using Angular 6, Visual Studio: Input restrictions in a form with Angular 6
Create Front end application
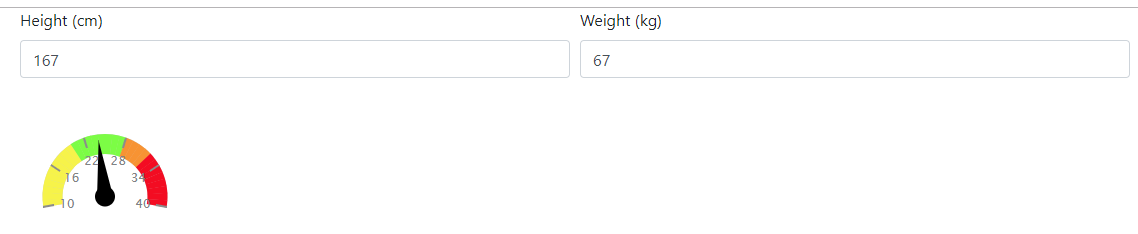
You can find the following screen shows how to render a ZingChart gauge using a Angular component.
Install zingchart libraries
First of all, Let's install zingchart packages from npm

npm i zingchart

We have to add zingchart minified file to index.html file, let's add that into body section of the page using a script tag.

<!doctype html>

<html lang="en">

<head>

  <meta charset="utf-8">

  <title>BMI Calculator</title>

  <base href="/">


  <meta name="viewport" content="width=device-width, initial-scale=1">

  <link rel="icon" type="image/x-icon" href="favicon.ico">

</head>

<body>

  <app-root></app-root>

  <script src= "https://cdn.zingchart.com/zingchart.min.js"></script>

</body>

</html>
Explore angular form with input controls
Let's explore app.component file, it's going to load the form with weight and height textboxes and render zingchart gauge based on the values,

<div class="container">

    <form>

        <div class="form-row">

          <div class="form-group col-md-6">

            <label for="height">Height (cm)</label>

            <input type="number" class="form-control" id="height" name="height"

            placeholder="Height" [(ngModel)]="height" (change)="onValueChange()"/>

          </div>

          <div class="form-group col-md-6">

            <label for="weight">Weight (kg)</label>

            <input type="number" class="form-control" id="weight" name="weight"

            placeholder="Weight" [(ngModel)]="weight" (change)="onValueChange()"/>

          </div>

        </div>

        <div class="form-group">

          <app-chart></app-chart>

        </div>

      </form>

</div>

import { Component, OnInit } from '@angular/core';

import { ChartComponent } from './shared/app.chart';


@Component({

  selector: 'app-root',

  templateUrl: './app.component.html',

  styleUrls: ['./app.component.css'],

  providers:[ChartComponent]

})


export class AppComponent implements OnInit{

  weight : number;

  height : number;

  bmi : string;


  constructor(private chartComponent : ChartComponent){}


  ngOnInit() {

    this.weight = 0;

    this.height = 0;

  }


  onValueChange() {

    var bmi = (this.weight / ((this.height / 100) * (this.height / 100)));

    if (isNaN(bmi) || bmi < 10)

      bmi = 10;

    else if (bmi > 40)

      bmi = 40;

    this.bmi = bmi.toFixed(2);

    this.chartComponent.ChangeChartValue(this.bmi);

  }

}
Go through app.module file, we have imported ChartComponent, it's going to handle the rendering process of zingchart component,

import { BrowserModule } from '@angular/platform-browser';

import { NgModule } from '@angular/core';

import {ChartComponent} from './shared/app.chart';

import { FormsModule } from '@angular/forms';

import { AppComponent } from './app.component';


@NgModule({

  declarations: [

    AppComponent,

    ChartComponent

  ],

  imports: [

    BrowserModule,

    FormsModule

  ],

  providers: [],

  bootstrap: [AppComponent]

})

export class AppModule { }
Explore Zingchart gauge component
We have created a seperate angular component to render zingchart gauge, Let's add a div tag and render it from there.

<div id="{{chart.id}}"></div> You can see app.chart component as below. It has created a chart object with Chart interface and passed configuration values to the chart. Note that initial value for gauge component is passed as 25.
When height and weight value changes, chartchange method is called and render the new value in the component.

import { Component, AfterViewInit } from '@angular/core';


declare var zingchart: any;


@Component({

    selector: 'app-chart',

    templateUrl: './app.chart.html',

    styleUrls: ['./app.chart.scss']

  })


export class ChartComponent implements AfterViewInit {


    chart: Chart = {

        id: "chart-1",

        data: {

          "type": "gauge",

          "scale-r": {

            "aperture": 200,

            "values": "10:40:1",

            "center": { "size": 10, "background-color": "#000", "border-color": "none" },

            "guide": { "visible": true },

            "item": { "visible": true },

            "tick": { "visible": true },

            "ring": {

              "size": 20,

              "rules": [

                { "rule": "%v >= 10 && %v <= 20", "background-color": "#f6f34a" },

                { "rule": "%v >= 20 && %v <= 28", "background-color": "#7cfd45" },

                { "rule": "%v >= 28 && %v <= 32", "background-color": "#f79333" },

                { "rule": "%v >= 32 && %v <= 40", "background-color": "#f30c22" },

              ]

            }

          },

          "plot": { "csize": "8%", "size": "90%", "background-color": "#000000" },

          "series": [ { "values": [ 25 ] } ]

        },

        height: 170,

        width: 170

      };


      ngAfterViewInit() {

        zingchart.render(this.chart);

      }


      ChangeChartValue (value){

        zingchart.exec('chart-1', 'setseriesvalues', {

          plotindex : 0,

          values : [Number(value)]

      });

   }


}


interface Chart {

    id:string;

    data : {};

    height : number;

    width : number;

   }
Finally, you can see the solution structure from the below picture, we have created a shared component to render chart control and used it in the app.component file.

Download
TechNet Gallery
You can download the sample code from TechNet gallery, angular-zingchart-gauge
GitHub
Conclusion
In this article, we saw how to render a zingchart gauge control into the screen using Angular 6. When form values (height and width) are getting changed, we change the rendering value in the gauge control.
